Original
December 2025, Volume 38, nº 6
16 min
A clinically relevant reinterpretation of disk approximation testing for inducible AmpC in Pseudomonas aeruginosa
Arturo Reyes-Gualito1 , Luis Raúl Rivera-Garay1, Azyadeh Cobo-Alva1, María José Orozco-Uriarte2, Alejandro E. Macías2, José Antonio Álvarez-Canales2,3*
1Microbiology Laboratory, Clinical Analysis of León, HRAEB Unit, León, Guanajuato, México
2Department of Medicine and Nutrition, University of Guanajuato, León, Guanajuato, México
3Research Department, High Specialty Regional Hospital at El Bajío, Servicios de Salud del Instituto Mexicano del Seguro Social para el Bienestar (IMSS-Bienestar), León, Guanajuato, México
http://www.doi.org/10.37201/req/089.2025
Receipt Date:
28/08/2025
Acceptance Date:
03/10/2025
Publication Date:
20/11/2025
How to cite
Reyes-Gualito A, Rivera-Garay LR, Cobo-Alva A, Orozco-Uriarte MJ, Macías AE, Álvarez-Canales JA. A clinically relevant reinterpretation of disk approximation testing for inducible AmpC in Pseudomonas aeruginosa. Rev Esp Quimioter 2025; 38(6):485-494. Available from: http://www.doi.org/10.37201/req/089.2025
Metrics
591
Views
93
Downloads
Share
Share
Abstract (EN)
Introduction: Current antimicrobial susceptibility methods fail to capture the variability of AmpC induction pathways in Pseudomonas aeruginosa. This leads to preventable errors in ceftazidime susceptibility reporting. We introduce a reinterpretation for the disk approximation test, based on the categorical change in ceftazidime susceptibility upon imipenem exposure.
Materials and methods: A total of 73 ceftazidime-susceptible P. aeruginosa isolates were evaluated. Automated broth microdilution test was the reference standard. AmpC inducibility was conventionally defined as a ≥5 mm flattening of the ceftazidime inhibition zone adjacent to imipenem. Our novel criterion for inducibility was a change in ceftazidime category from susceptible to nonsusceptible. The probability of error in ceftazidime reporting was evaluated with three parameters. ROC curve, comparative and regression analyses were performed.
Results: The reference method showed an overall error probability of 35.6%. The conventional 5 mm cutoff interpretation reduced this rate to 5.4%, but generated a significant proportion of false positives and negatives. Regression analyses showed that the flattening effect is a strong predictor of the categorical change. No association was found between basal ceftazidime susceptibility and AmpC inducibility.
Conclusion: Our reinterpretation criterion for disk approximation test turns a phenotypic assay into a clinically relevant diagnostic tool to avoid errors in ceftazidime susceptibility reports. Moreover, this interpretation is readily applicable in routine microbiology laboratories, and has the potential to be directly useful for antimicrobial stewardship efforts.
Keywords (EN):
AmpC
Disk difussion
Antimicrobial resistance
Imipenem
Ceftazidime
[i]Pseudomonas aeruginosa[/i]
Introduction
Therapeutic success of Pseudomonas aeruginosa infections critically depends on accurate antimicrobial susceptibility testing [1-3]. AmpC β-lactamase is the predominant resistance mechanism in this pathogen and its hyperepression can be induced during therapy with certain β-lactams [4-6]. Thus, isolates initially reported as susceptible, such as to ceftazidime, can rapidly develop resistance, undermining treatment efficacy [7,8]. Current susceptibility methods are unable to detect this induction process. As a result, diagnostic errors may occur, leading not only to therapeutic failure but also to the selection of derepressed AmpC-variants with potential enhanced activity against β-lactam/β-lactamase inhibitor combinations [9-11]. Molecular studies have shown that AmpC induction is a heterogeneous process involving distinct regulatory pathways [12]. In Enterobacterales, this variability has been translated into high- and low-risk categories of inducibility that prevent therapeutic failure [13-15]. However, currently no criterion exists to clinically interpret inducibility in P. aeruginosa. In order to overcome this issue, several phenotypic assays, such as the disk approximation test, have been proposed to detect AmpC induction. Nevertheless, their interpretation relies on subjective observations or arbitrary diameter cutoffs [16-18], providing limited reproducibility and uncertain clinical significance. Although the disk approximation test is not a new method, we hypothesize that its reinterpretation can provide a more clinically relevant and reproducible criterion to identify AmpC inducibility in P. aeruginosa. This paradigm change has the potential to prevent errors in ceftazidime reporting and support antimicrobial stewardship efforts in real-world settings. Therefore, the aim of this study was to evaluate an innovative interpretative criterion for phenotypic detection of AmpC inducibility based on a categorical change in ceftazidime susceptibility in clinical isolates of P. aeruginosa.Materials and methods
Study design and ethics A cross-sectional study was performed at Hospital Regional de Alta Especialidad del Bajío (HRAEB), México, in a 16-month period. This tertiary care centre provides services mainly to kidney transplant recipients and patients with oncohematological diseases. This protocol was approved by both HRAEB Research and Ethics Committees under registration numbers CI/HRAEB/015/2024 and CEI-020-2024, respectively. No interventions were performed on patients, as this work was conducted in accordance with the Declaration of Helsinki. The requirement for informed consent was waived due to the retrospective nature of the study and the use of anonymized patient data. Sampling and inclusion criteria P. aeruginosa strains were isolated from blood, urine, body fluids, and respiratory secretions of both inpatients and outpatients. To avoid duplicates, only the first isolate per patient was included. We restricted the analysis to ceftazidime-susceptible isolates, since resistant ones usually represent a fully AmpC-induced state in which inducibility cannot be further assessed. This also minimized the confounding effect of additional resistance mechanisms. Demographic information was obtained from clinical and laboratory records. Sample size calculation A minimum sample size of 47 isolates was determined. We set the assumed population prevalence (p0) of AmpC inducibility at 60%, based on reported rates ranging from 24.3% (genotypic methods) to 85% (phenotypic methods) [4,8]. We estimated an expected prevalence (p1) in our target population (ceftazidime-susceptible P. aeruginosa isolates) at 40%, representing a clinically relevant difference of 20%. A significance level α=0.05 and statistical power 1-β=80% were used. The following formula was used, where q0=1-p0 and q1=1-p1: Identification and susceptibility testing
The identification and automated broth microdilution susceptibility testing were performed with Vitek-2® system (bioMeriéux®, Durham NC), considered the reference standard. Susceptibility results were interpreted according to CLSI standards in document M100 [19]. This susceptibility interpretation guideline served as a reference for quantifying the rate of misclassified isolates.
Determination of AmpC inducibility
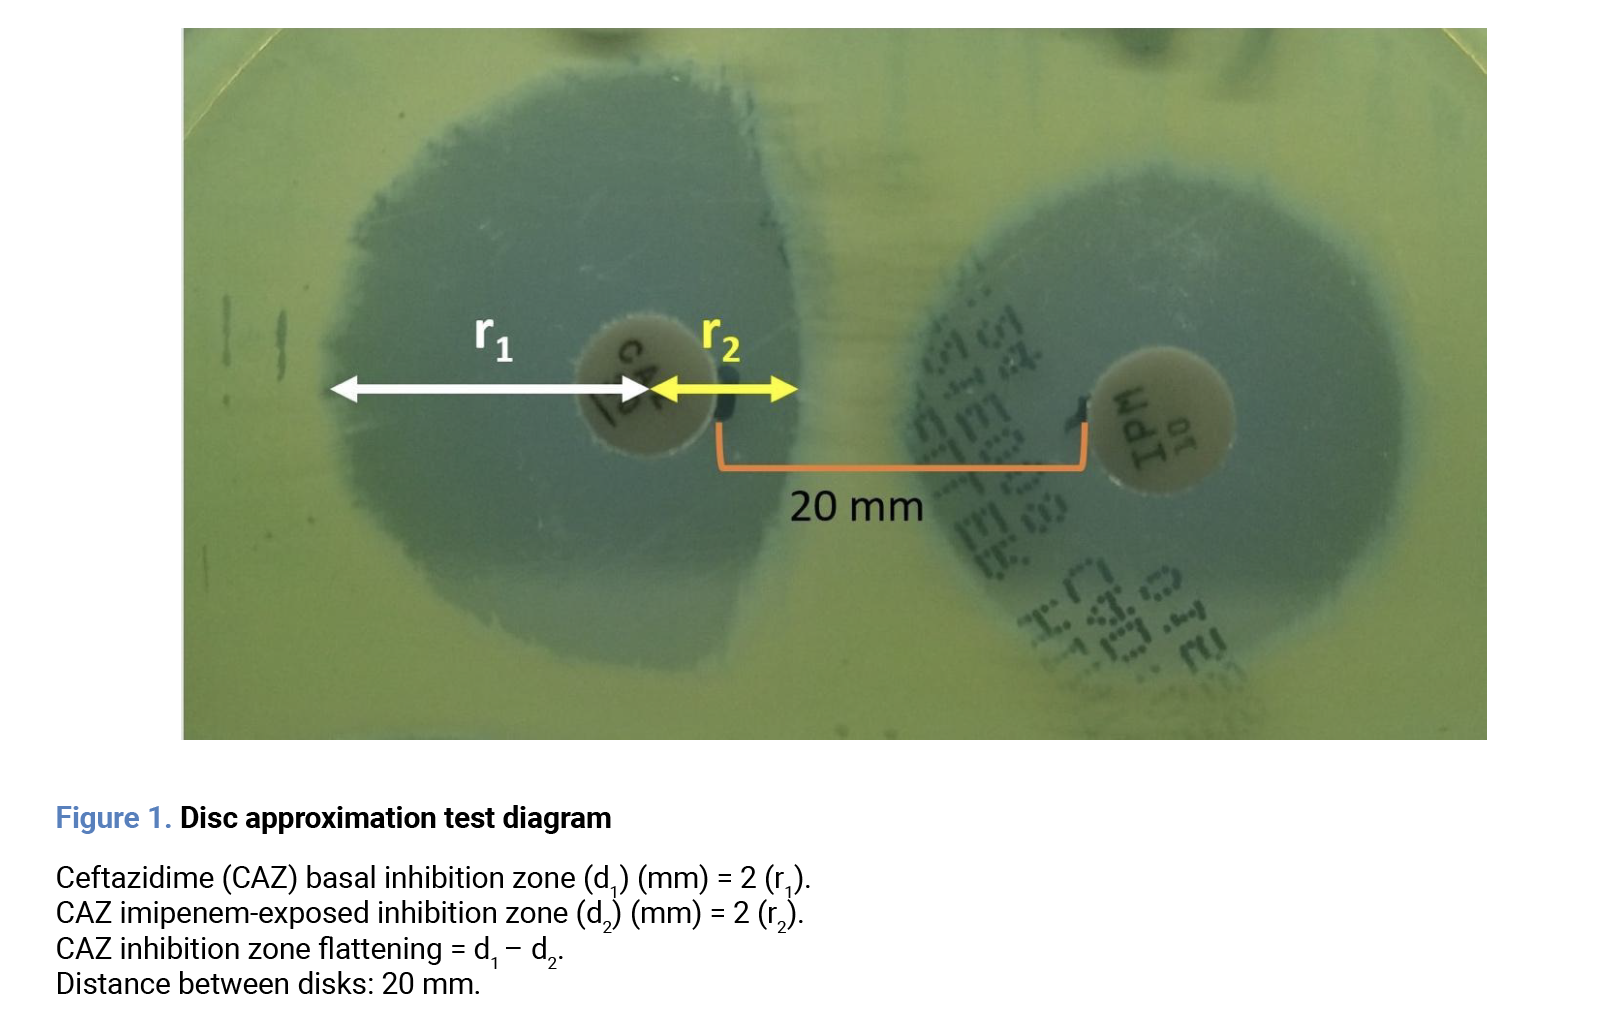
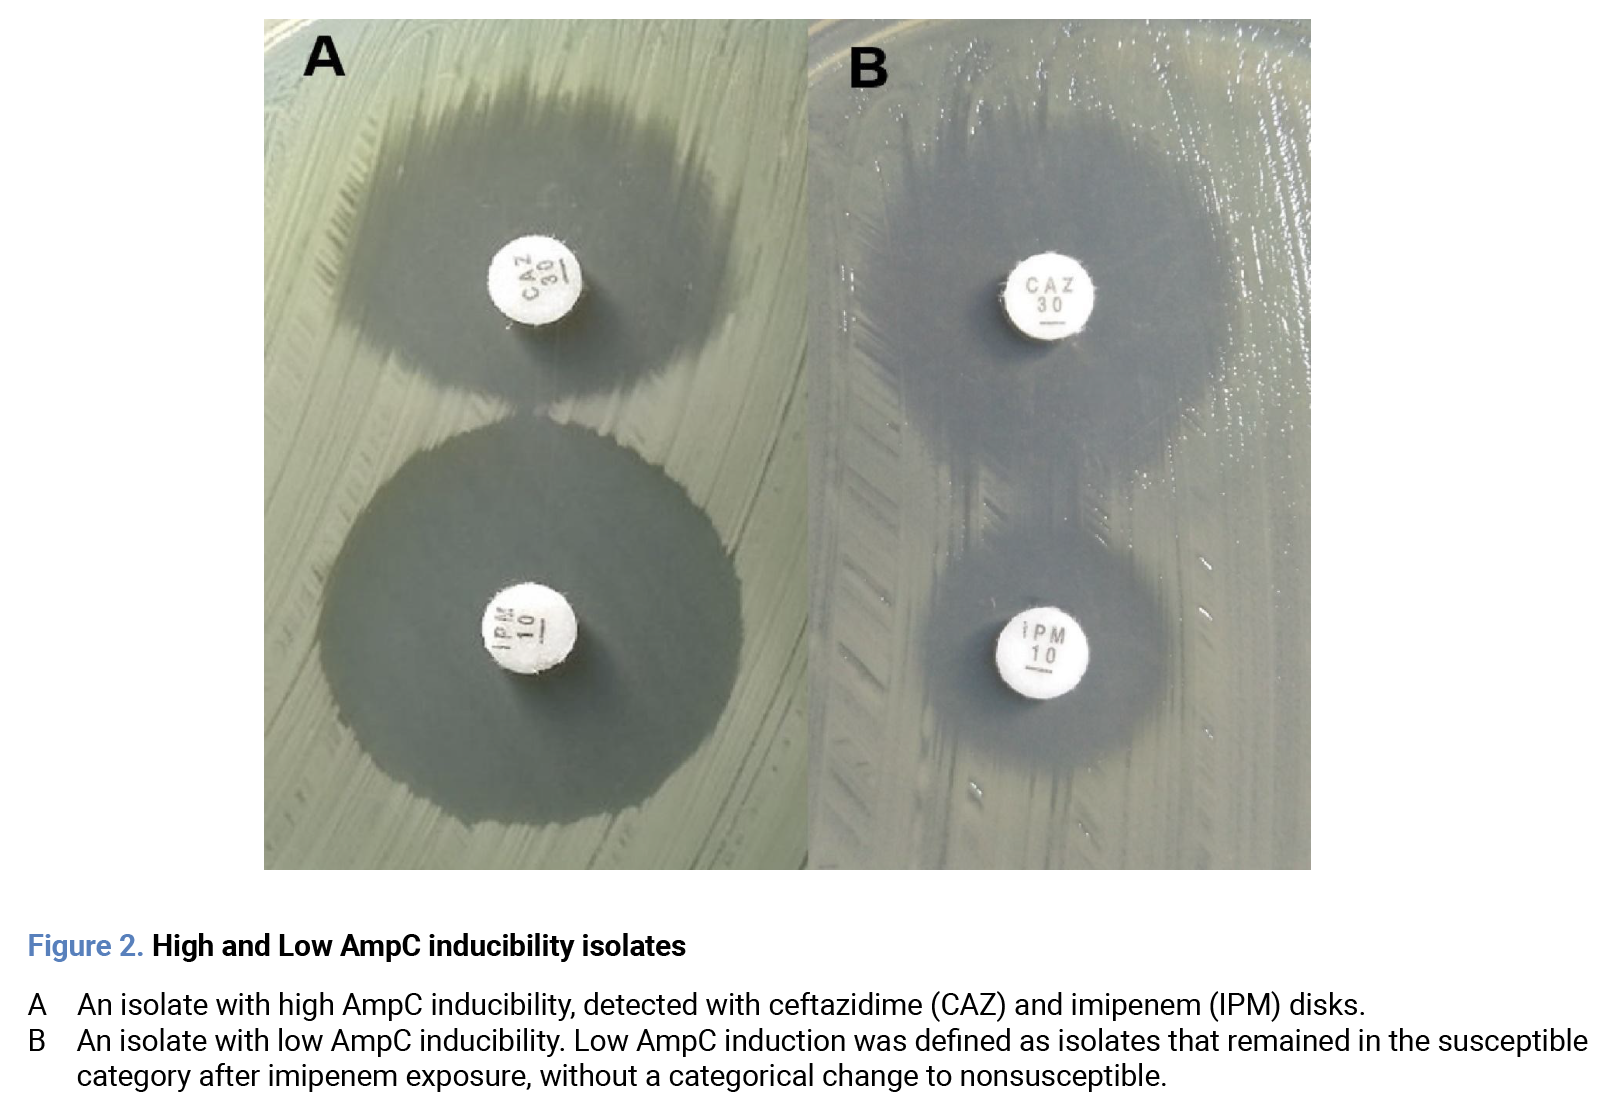
AmpC inducibility was defined as the potential of an isolate to increase enzymatic production upon exposure to an inducer agent. This was operationalized as the categorical change of ceftazidime susceptibility after imipenem exposure. Changes to intermediate and resistant were grouped as “nonsusceptible”, since both reflect reduced susceptibility. Thus, susceptibility cutoff was set at ≥18 mm, according to CLSI breakpoints [19]. AmpC inducibility determination was performed with the disk approximation test [16,18]. The surface of a plate with Mueller-Hinton medium (BBL®, CDMX) was inoculated with a 0.5 McFarland suspension of the tested isolate. Disks of ceftazidime (30 µg, Oxoid®, UK) and imipenem (10 µg, Oxoid®, UK) were placed 20 mm apart, edge to edge. The plate was incubated at 35±2°C for 18 to 24 hours. After incubation, ceftazidime inhibition zone radii were measured with a caliper on the imipenem-exposed and unexposed sides. The flattening effect was defined as their difference, serving as a quantitative estimate of AmpC induction (Figure 1). Examples of both high and low AmpC inducibility isolates are shown in Figure 2.
 Evaluation of diagnostic discrimination of conventional assessment of AmpC inducibility
Conventional definitions of AmpC inducibility rely on heterogeneous criteria, such as visual flattening of the inhibition zone or arbitrary diameter reductions [16-18]. To evaluate the performance of these criteria and highlight their limitations, we constructed a ROC curve using our operational definition (categorical change of ceftazidime from susceptible to nonsusceptible after imipenem exposure) as the reference. This identified the flattening cutoff that maximized discrimination, but it did not serve as validation of our operational definition.
Evaluation of probability of error due to misclassification
To estimate the potential error of the reference method and the conventional inducibility criterion, we calculated the overall misclassification error probability (pE), defined as the proportion of isolates categorized as susceptible that were reclassified as nonsusceptible after imipenem exposure. However, as intermediate and resistant categories have different clinical implications, we reported the probability of Very Major Errors (pVME), defined as the proportion of isolates categorized as susceptible that were reclassified as resistant; and the probability of minor Errors (pmE), defined as the proportion of isolates categorized as susceptible that were reclassified as intermediate [20].
Statistical methods
Regarding descriptive analyses, quantitative variables were reported as median (Me) and interquartile range (IQR); normality was evaluated with Shapiro-Wilk’s test. Qualitative variables were reported as percentages. Bivariate comparative analysis was performed with both frequentist and Bayesian approaches. For frequentist analysis, the Mann-Whitney U or Kruskal-Wallis tests were used for quantitative variables; chi-square or Fisher’s exact test for qualitative variables. For the Bayesian analysis, the magnitude of effect size and Bayes Factor (BF10) were calculated. The significance was interpreted according to the Jeffreys criterion. Logistic and linear regression models were built to explore the relationships between variables and the main outcome. A p-value < 0.05 was considered statistically significant for frequentist analyses. All statistical analyses were performed using the JASP® software (Version 0.19.3) [Computer software] (JASP Team, 2024).
Results
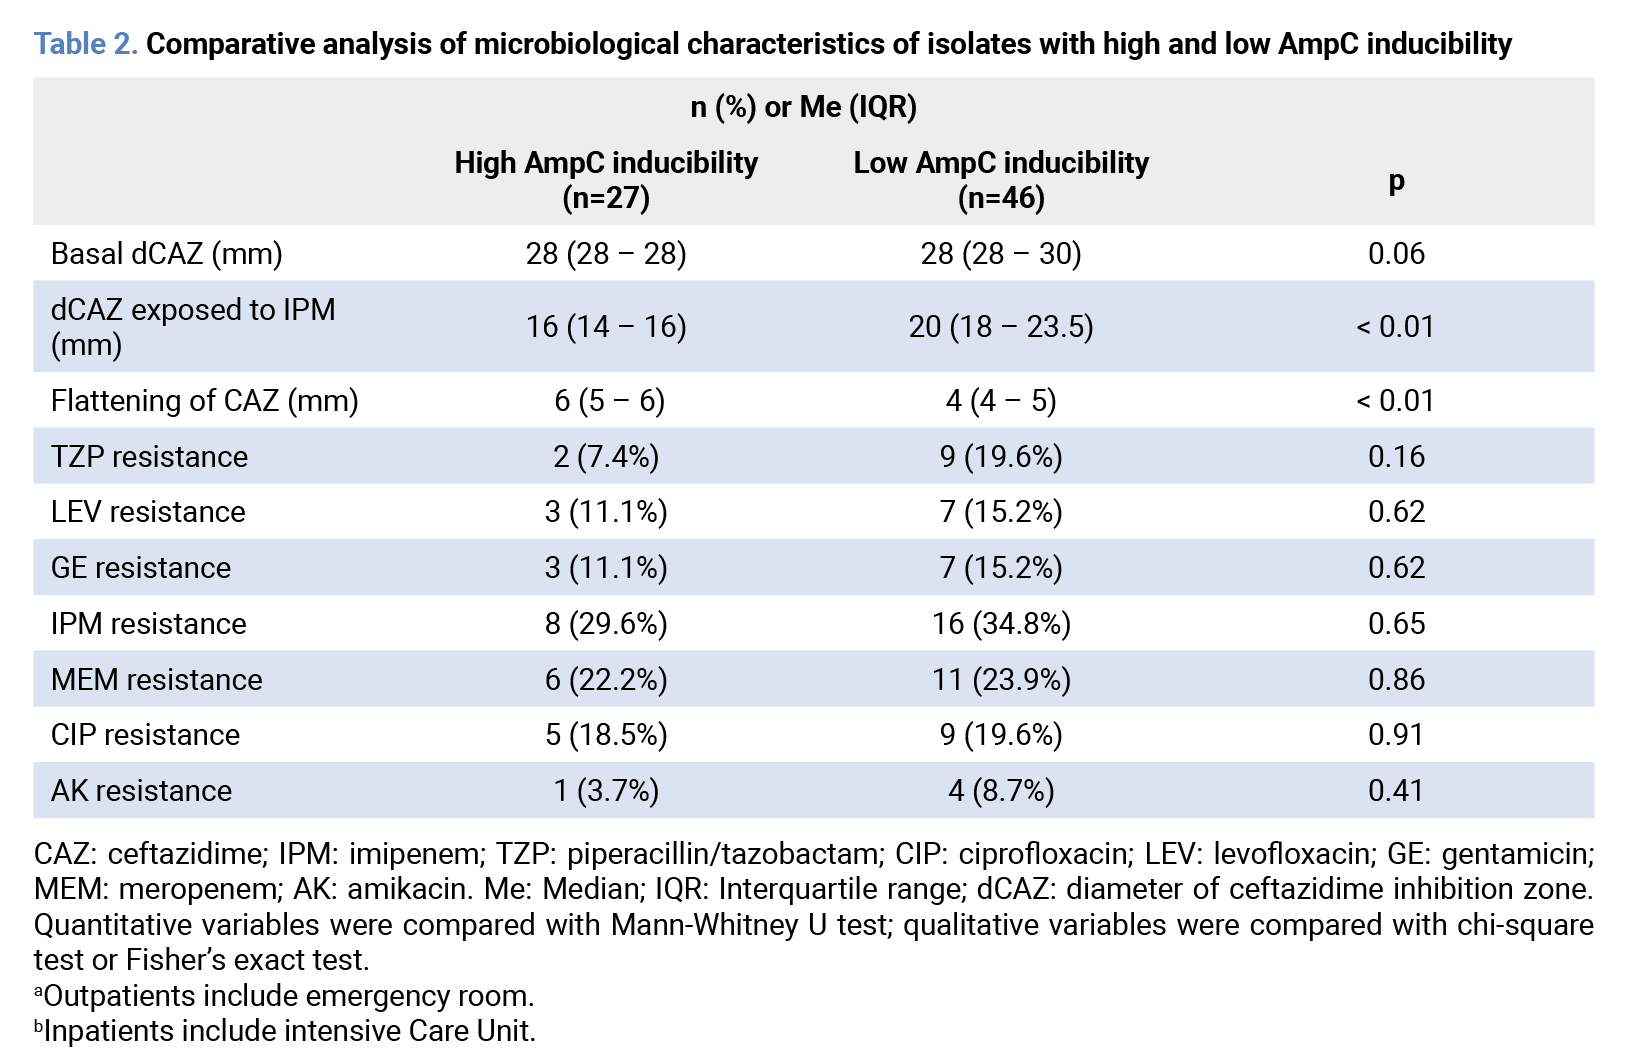
General analysis We observed a categorical change in ceftazidime susceptibility from susceptible to nonsusceptible in 26 of 73 P. aeruginosa isolates, which were labeled as high AmpC inducibility isolates. Specifically, 8 isolates to resistant and 18 to intermediate categories. Conversely, 47 isolates were considered with low AmpC inducibility. No significant differences were observed regarding demographic, (p˃0.05) clinical, (p˃0.05) or antimicrobial susceptibility profiles between groups. (p˃0.05) A detailed description of demographic and clinical characteristics is shown in Table 1. Comparison of antimicrobial susceptibility profiles is shown in Table 2.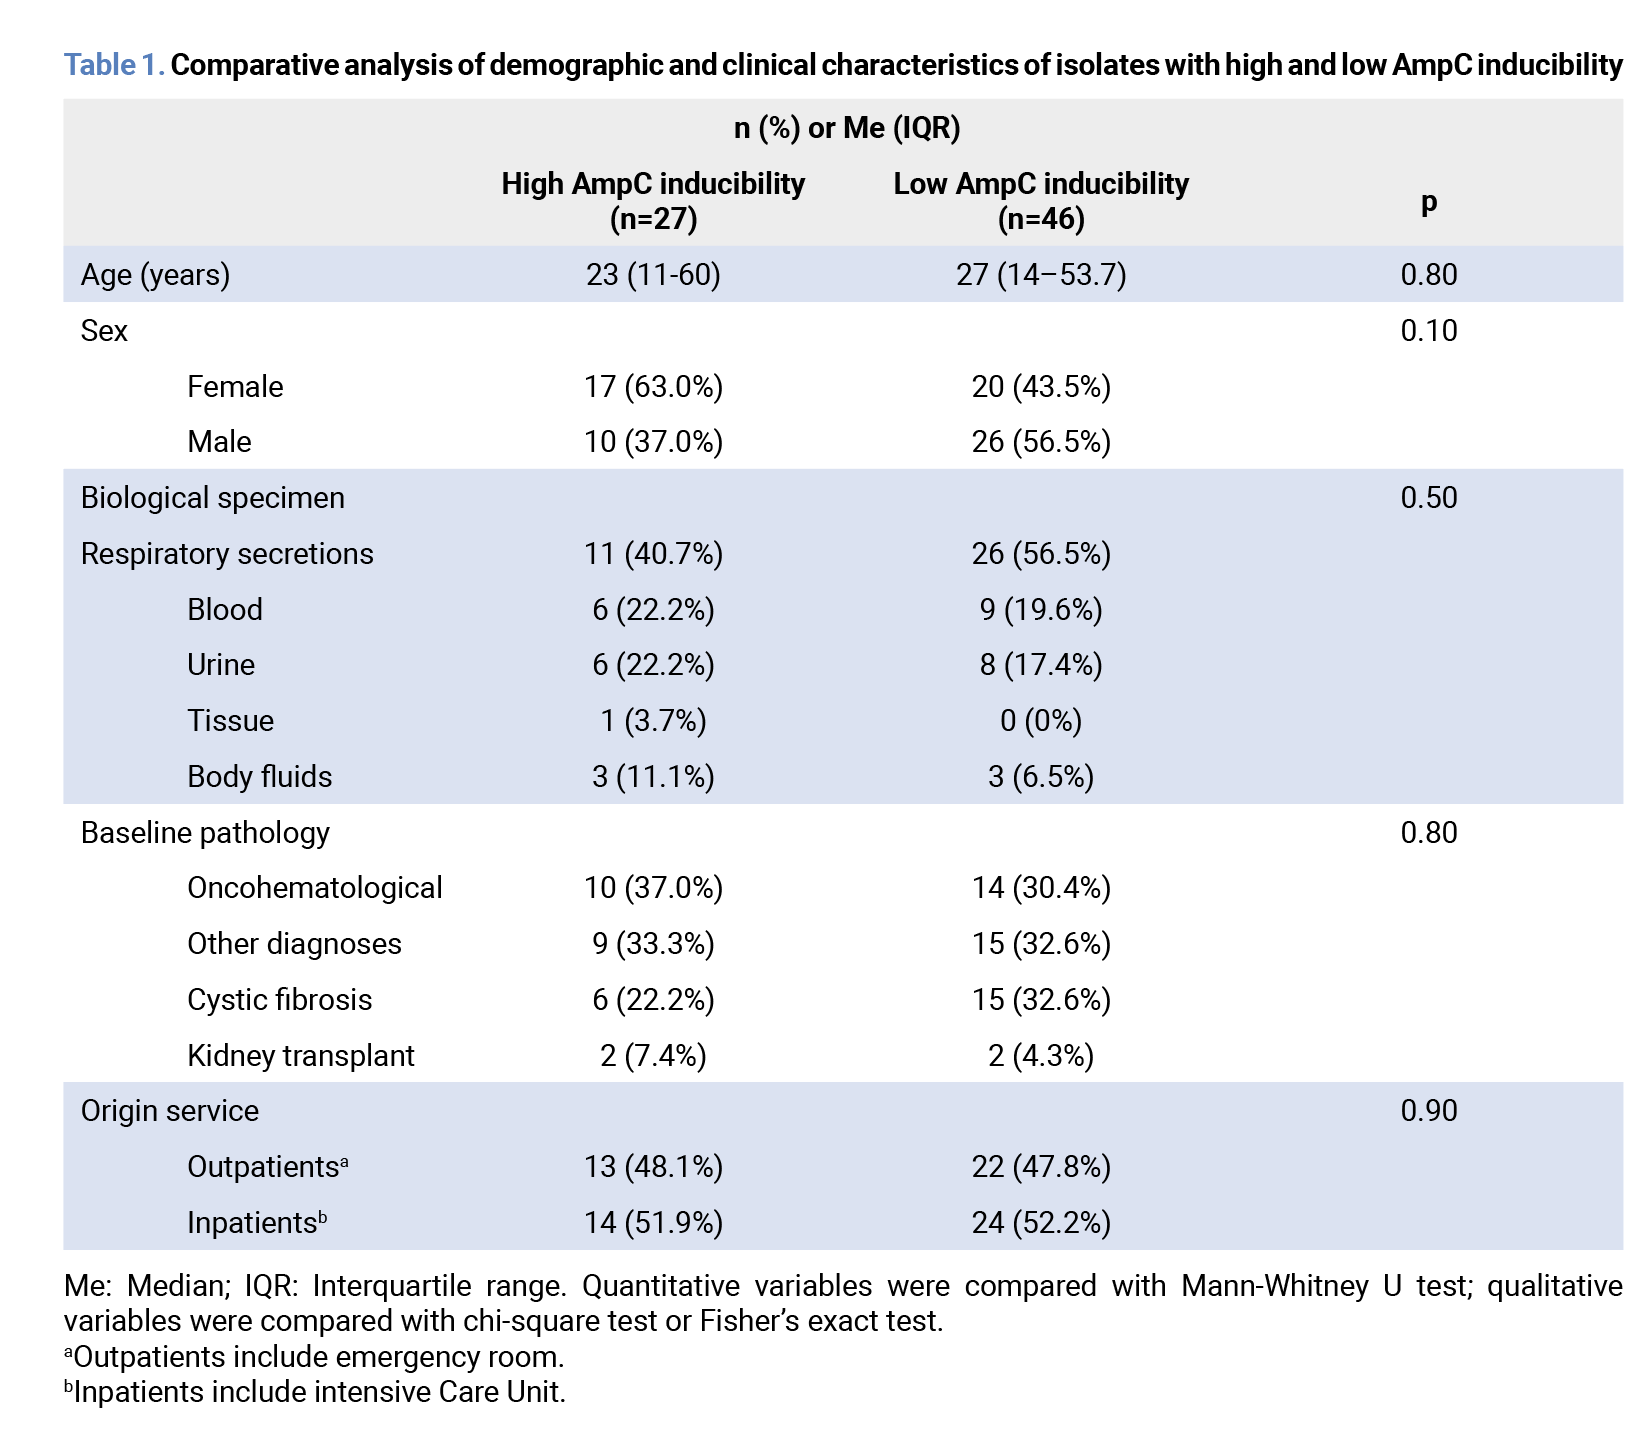
 ROC curve analysis
 determined a ≥5 mm cutoff point for the flattening effect as the best predictor of AmpC inducibility, with a sensitivity of 0.85 (95% CI 0.66 to 0.96), a specificity of 0.67 (95% CI 0.52 to 0.80), a positive predictive value of 0.60, a negative predictive value of 0.88, a positive likelihood ratio of 2.61, a Youden index of 0.52 and a AUROC of 0.79 (95% CI 0.67 to 0.87; p < 0.01). Figure 3 shows the ROC curve of this analysis.
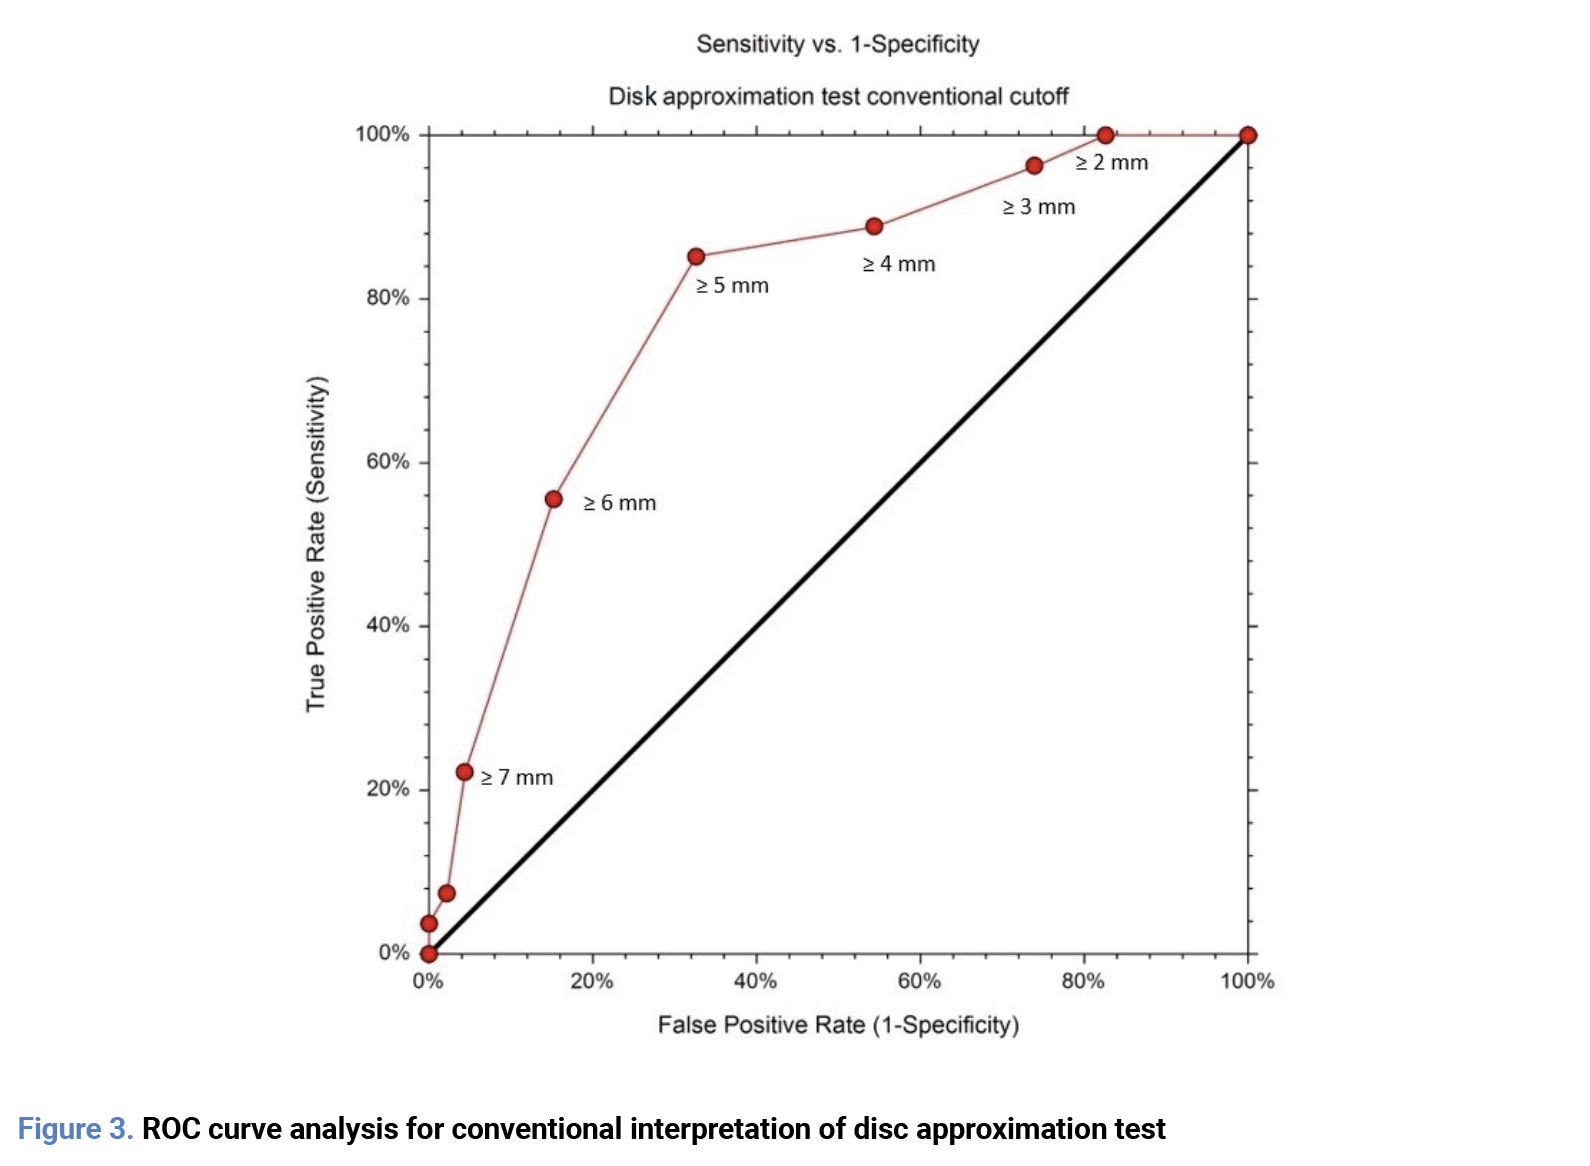 Misclassification error probability analysis
A pE of 36.5% was calculated for the reference method, with a pVME of 10.9% and a pmE of 24.6%. The conventional inducibility interpretation, with an optimized cutoff point of ≥ 5mm, reduced pE to a 5.4%. Although a reduction was observed for pmE (19.2%), pVME did not change (10.9%). Moreover, we observed significant proportions of false positives (isolates with a flattening ≥ 5mm, but remained susceptible post imipenem exposure) of 42.1%, and false negatives (isolates with a flattening < 5mm, but changed to nonsusceptible) of 11.4%.
Ceftazidime susceptibility comparative analysis
Baseline susceptibility to ceftazidime did not differ between groups, from frequentist (U = 782, p = 0.058) and Bayesian (median effect size: 0.41, 95% Credible interval: -0.03 to 0.89; BF10 = 1.27) approaches. After exposure to imipenem, high-inducibility isolates showed lower susceptibility, from frequentist (U=1217, p < 0.01) and Bayesian (median effect size: 1.39, 95% Credible interval: 0.84 to 1.93; BF10 = 38700) approaches. Moreover, high-inducibility isolates showed a greater flattening, from frequentist (U=250, p < 0.01) and Bayesian (median effect size: -0.84, 95% Credible interval: -1.36 to -0.35; BF10 = 84.54) approaches. A detailed description is shown in Table 2. Figure 4 shows visually the differences in the three parameters.
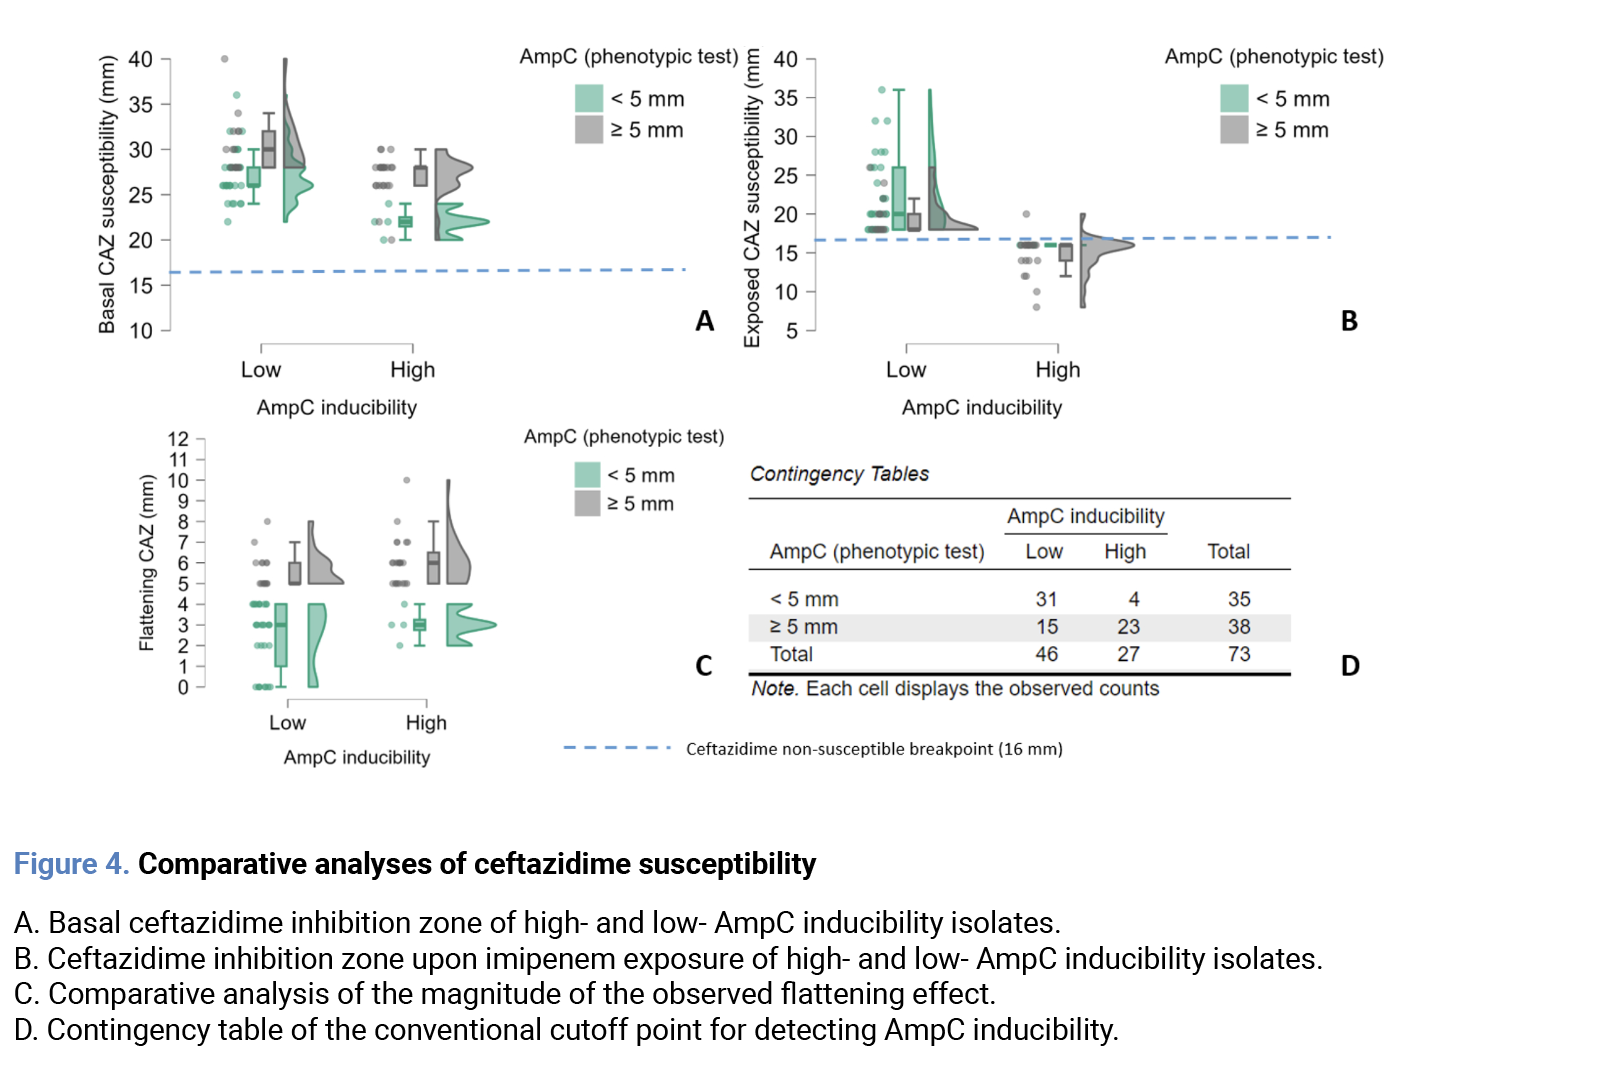 a) Stratified ceftazidime susceptibility comparative analysis
No significant differences in baseline susceptibility were observed between isolates which changed to intermediate and those which changed to resistant, from frequentist (U=78.5; p=0.72) and Bayesian approaches (median effect size: 0.13; 95% Credible interval: -0.54 to 0.86; BF10 = 0.47). The flattening effect was slightly larger in isolates which changed to resistant compared to isolates which changed to intermediate. Although this difference was significative from frequentist approach (U=30.0, p=0.04), Bayesian evidence provided weak support for this finding (median effect size: -0.83; 95% Credible interval: -1.73 to -0.02; BF10 =3.2).
b) Ceftazidime susceptibility comparative analysis in imipenem-susceptible and resistant isolates
To evaluate the potential effect of imipenem susceptibility on ceftazidime susceptibility, we performed a comparative subanalysis between imipenem-susceptible and imipenem-resistant isolates. No significant differences were observed in basal susceptibility, (frequentist: U=571.0; p=0.84; Bayesian: median effect size: 0.003; 95% Credible interval: -0.44 to 0.45; BF10=0.25) inhibition zones exposed to imipenem, (frequentist: U=548.0; p=0.63; Bayesian: median effect size: 0.05; 95% Credible interval: -0.38 to -0.51; BF10=0.26) nor the flattening effect. (frequentist: U=540.0; p=0.57; Bayesian: median effect size: -0.12; 95% Credible interval: -0.58 to -0.31; BF10=0.30).
Regression analyses
a) Linear regression analysis
A linear regression analysis was performed to determine if basal ceftazidime susceptibility had a significant effect on the flattening of the inhibition zone. The model showed a poor fit (R2 = 0.039). The regression coefficient for the basal ceftazidime inhibition zone was β = 0.130 (95% CI: -0.022 to 0.283), but this was not statistically significant (p = 0.09).
b) Logistic regression analysis
A logistic regression analysis was performed to determine if basal ceftazidime inhibition zone, imipenem resistance or the observed flattening of the inhibition zone were adequate predictors of the change in ceftazidime susceptibility category. The first model included basal ceftazidime inhibition zone and imipenem resistance. This model showed poor fit (McFadden R2=0.069). Basal ceftazidime inhibition zone was found to be a significant predictor (OR=0.80, 95% CI: 0.67 to 0.96, p=0.02). In contrast, imipenem resistance was not a significant predictor (OR=0.78, 95% CI: 0.26 to 2.28, p=0.652). The second model evaluated the flattening of inhibition zone and imipenem resistance. This model showed an improved fit (McFadden R2=0.222). The flattening of ceftazidime inhibition zone was a significant predictor (OR=2.02, 95% CI: 1.37 to 2.90, p < 0.001). Imipenem resistance remained a non-significant predictor (OR=0.58, 95% CI: 0.17 to 1.94, p=0.378).
Discussion
Our findings demonstrate a major limitation of current automated susceptibility testing, as 35.6% of P. aeruginosa isolates are at risk of AmpC hyperexpression, including one in ten reaching clinically relevant resistance. The disk approximation test has been proposed to overcome this, but its interpretative heterogeneity has limited its reproducibility. In our study, even with an optimized 5 mm cutoff, errors persisted, particularly VME. Although the AUROC suggested moderate predictive power, the low Youden index underscored that a dichotomous cutoff interpretation cannot capture the continuum of AmpC induction. This was reflected in the rate of misclassifications, both FP and FN, limiting the test as a diagnostic paradigm. A concern is whether our proposed criterion overlaps with the outcome definition itself. AmpC induction is the biological process of increased enzyme production after exposure to an inducer. Our criterion defines “inducibility” as the potential of an isolate to show a categorical change in ceftazidime susceptibility after said exposure. Consequently, our criterion links the biological induction process to its clinical consequence. This provides an operational definition for routine testing, since susceptibility categories are designed to predict therapeutic success. These differences in susceptibility loss observed among isolates may align with previous experimental evidence describing three distinct induction pathways, each associated with a different resistance level [12]. This bridges the gap between a complex molecular process and a practical diagnostic tool, with potential implications for clinical decision-making. This would be analogous to the recent stewardship recommendations for ceftriaxone in AmpC producing Enterobacterales at high risk of hyperexpression [13-15]. Thus, our data suggest avoiding de-escalation to ceftazidime in high inducibility isolates, particularly after carbapenem therapy, potentially reducing the risk of therapeutic failure. Moreover, this may help to prevent further resistance to novel β-lactam/β-lactamase inhibitor combinations, as these isolates are at increased risk of structural mutations that broaden the enzyme’s hydrolytic spectrum [9-11]. Conversely, identification of low inducibility isolates might support the use of ceftazidime as a reliable option, as this agent is a poor AmpC inducer. Nevertheless, current data are preliminary and require further validation studies. However, the main limitation of our study was the lack of genotypic or enzyme expression assays to identify the previously mentioned specific induction pathways. These analyses were outside the scope of our work, since our goal was to evaluate phenotypically the detection of AmpC inducibility. Additionally, there is clinical importance of AmpC hyperproducers in carbapenem-resistant isolates, but this requires alternative methodologies (cloxacillin or phenyl-boronic acid inhibition tests) which are beyond the scope of the present study. On the other hand, we consider highly relevant to analyze the effect of weak AmpC inducers on this biological process, since these agents are commonly used for the treatment of these infections [6]. Further prospective studies should assess the impact of this phenotypic differentiation on other relevant outcomes such as recurrence, subsequent hyperexpression or rates of therapeutic failure, including genotypic or enzyme expression analyses if possible. In conclusion, our findings show that categorical change in ceftazidime susceptibility is the most clinically relevant marker of AmpC inducibility in P. aeruginosa. This reinterpretation transforms a classic phenotypic assay into a practical diagnostic tool that can prevent susceptibility reporting errors, have the potential to support antimicrobial stewardship efforts, and delay resistance to broader-spectrum agents. Further validation and standardization will be essential for its inclusion in current susceptibility testing guidelines. Acknowledgments This study was conducted under the framework of the health services provided by the Instituto Mexicano del Seguro Social para el Bienestar (IMSS-BIENESTAR). We thank the Instituto Mexicano del Seguro Social para el Bienestar (IMSS-BIENESTAR) and Análisis Clínicos de León for the support and resources provided. Author contributions Conceptualization: ARG, JAC; Data curation: ARG; Formal analysis: ARG, MJOU; Funding acquisition: ACA; Investigation: ARG; Methodology: ARG, JAC; Project administration: JAC, AMH, LRRG; Resources: ACA, LRRG, JAC; Validation: JAC, MJOU, AMH; Visualization: ARG, MJOU, JAC; Writing-original draft: ARG, MJOU, JAC; Writing-review and editing: AMH, JAC, LRRG. All authors have read and agreed to the published version of the manuscript. Funding None to declare. Conflict of interest The authors declare that they have no conflicts of interest.References
- Wood SJ, Kuzel TM, Shafikhani SH. Pseudomonas aeruginosa: infections, animal modeling, and therapeutics. Cells. 2023;12(1). Available from: https://doi.org/10.3390/cells12010199
- Horcajada JP, Montero M, Oliver A, Sorlí L, Luque S, Gómez-Zorrilla S, et al. Epidemiology and treatment of multidrug-resistant and extensively drug-resistant Pseudomonas aeruginosa infections. Clin Microbiol Rev. 2019;32(4). Available from: https://doi.org/10.1128/CMR.00031-19
- Hernández A, Yagüe G, Vázquez EG, Simón M, Parrado LM, Canteras M, et al. Nosocomial infections caused by multiresistant Pseudomonas aeruginosa (carbapenems included): predictive and prognostic factors. A prospective study (2016–2017). Rev Esp Quimioter. 2018;31(2):123–30.
- Langendonk RF, Neill DR, Fothergill JL. The building blocks of antimicrobial resistance in Pseudomonas aeruginosa: implications for current resistance-breaking therapies. Front Cell Infect Microbiol. 2021;11. Available from: https://doi.org/10.3389/fcimb.2021.665759
- Pesantez DIE, Sanchez GFE. Enzymatic resistance in Pseudomonas aeruginosa: clinical and laboratory aspects. Rev Chilena Infectol. 2021;38(1):69–80. Available from: https://doi.org/10.4067/S0716-10182021000100069
- Tamma PD, Aitken SL, Bonomo RA, Mathers AJ, Van Duin D, Clancy CJ. Infectious Diseases Society of America 2022 guidance on the treatment of extended-spectrum β-lactamase producing Enterobacterales (ESBL-E), carbapenem-resistant Enterobacterales (CRE), and Pseudomonas aeruginosa with difficult-to-treat resistance (DTR-P. aeruginosa). Clin Infect Dis. 2022;75(2):187–212. Available from: https://doi.org/10.1093/cid/ciac268
- Freed S Jr, Hanson ND. AmpC induction by imipenem in Pseudomonas aeruginosa occurs in the absence of OprD and impacts imipenem/relebactam susceptibility. Microbiol Spectr. 2024;12(11):e00142-24. Available from: https://doi.org/10.1128/spectrum.00142-24
- Alimoghadam S, Eslami A, Alimoghadam R, Bahrami Mianrood I, Azizmohammad Looha M, Khodadadi S, et al. The frequency of AmpC overproduction, OprD downregulation and OprM efflux pump expression in Pseudomonas aeruginosa: a comprehensive meta-analysis. J Glob Antimicrob Resist. 2024;39:159–69. Available from: https://doi.org/10.1016/j.jgar.2024.08.014
- Slater CL, Winogrodzki J, Fraile-Ribot PA, Oliver A, Khajehpour M, Mark BL. Adding insult to injury: mechanistic basis for how AmpC mutations allow Pseudomonas aeruginosa to accelerate cephalosporin hydrolysis and evade avibactam. Antimicrob Agents Chemother. 2020;64(9). Available from: https://doi.org/10.1128/AAC.00894-20
- Arca-Suárez J, Vázquez-Ucha JC, Fraile-Ribot PA, Lence E, Cabot G, Martínez-Guitián M, et al. Molecular and biochemical insights into the in vivo evolution of AmpC-mediated resistance to ceftolozane/tazobactam during treatment of an MDR Pseudomonas aeruginosa infection. J Antimicrob Chemother. 2020;75(11):3209–17. Available from: https://doi.org/10.1093/jac/dkaa291
- Fraile-Ribot PA, Cabot G, Mulet X, Periañez L, Martín-Peña ML, Juan C, et al. Mechanisms leading to in vivo ceftolozane/tazobactam resistance development during the treatment of infections caused by MDR Pseudomonas aeruginosa. J Antimicrob Chemother. 2018;73(3):658–63. Available from: https://doi.org/10.1093/jac/dkx424
- Torrens G, Hernández SB, Ayala JA, Moya B, Juan C, Cava F, et al. Regulation of AmpC-driven β-lactam resistance in Pseudomonas aeruginosa: different pathways, different signaling. mSystems. 2019;4(6). Available from: https://doi.org/10.1128/mSystems.00524-19
- Maillard A, Dortet L, Delory T, Lafaurie M, Bleibtreu A, Azoulay E, et al. Mutation rate of AmpC β-lactamase–producing Enterobacterales and treatment in clinical practice: a word of caution. Clin Infect Dis. 2024;79(1):52–5. Available from: https://doi.org/10.1093/cid/ciae160
- Hardy ME, Kenney RM, Tibbetts RJ, Shallal AB, Veve MP. Leveraging stewardship to promote ceftriaxone use in severe infections with low- and no-risk AmpC Enterobacterales. Antimicrob Agents Chemother. 2023;67(11):e00826-23. Available from: https://doi.org/10.1128/aac.00826-23
- Tamma PD, Aitken SL, Bonomo RA, Mathers AJ, Van Duin D, Clancy CJ. Infectious Diseases Society of America guidance on the treatment of AmpC β-lactamase–producing Enterobacterales, carbapenem-resistant Acinetobacter baumannii, and Stenotrophomonas maltophilia infections. Clin Infect Dis. 2022;74(12):2089–114. Available from: https://doi.org/10.1093/cid/ciab1013
- Ingti B, Krishnatreya DB, Maurya AP, Chanda DD, Chakravarty A, Bhattacharjee A. Role of inducers in detection of blaPDC-mediated oxyimino-cephalosporin resistance in Pseudomonas aeruginosa. Indian J Med Res. 2017;145(5):659–64. Available from: https://doi.org/10.4103/ijmr.IJMR_628_15
- Dunne WM, Hardin DJ. Use of several inducer and substrate antibiotic combinations in a disk approximation assay format to screen for AmpC induction in patient isolates of Pseudomonas aeruginosa, Enterobacter spp., Citrobacter spp., and Serratia spp. J Clin Microbiol. 2005;43(12):5945–9. Available from: https://doi.org/10.1128/JCM.43.12.5945-5949.2005
- Al Mamari AMK, Al Jabri Z, Sami H, Rizvi SGA, Chan MF, Al Siyabi T, et al. Evaluation of six commercial and in-house phenotypic tests for detection of AmpC β-lactamases: is routine detection possible? JAC Antimicrob Resist. 2023;5(5). Available from: https://doi.org/10.1093/jacamr/dlad101
- Clinical and Laboratory Standards Institute (CLSI). Performance standards for antimicrobial susceptibility testing. 35th ed. CLSI supplement M100. Wayne, PA: CLSI; 2025.
- International Organization for Standardization. ISO 20776-2:2021. Clinical laboratory testing and in vitro diagnostic test systems — Susceptibility testing of infectious agents and evaluation of performance of antimicrobial susceptibility test devices — Part 2: Evaluation of performance of antimicrobial susceptibility test devices against reference broth micro-dilution. Available from: https://www.iso.org/standard/79377.html
Explore
Articles
Volumes
About the journal
Most read
Recomendaciones para la prevención y el tratamiento de las infecciones respiratorias en adultos mayores institucionalizados
Revista Española de Quimioterapia
Acute infectious gastroenteritis in childhood: the role of rapid multiplex molecular syndromic panels in diagnosis and clinical management
Revista Española de Quimioterapia
Características epidemiológicas de pacientes con aislamientos de Enterobacterales productores de carbapenemasas-NDM en un hospital de alta complejidad
Revista Española de Quimioterapia
Review on the management of intra-abdominal candidiasis
Revista Española de Quimioterapia
Neoscytalidium dimidiatum: a rare locally acquired deep cutaneous infection in a renal transplant recipient
Revista Española de Quimioterapia